BI and Data Visualization
Upskill with BISP
Powered By AI
Data Visualization Including Machine Learning Concepts using Tableau
BISP is now offering an in-depth understanding of Data Visualization Including Machine Learning concepts using Tableau for Tableau developers and complete Tableau Server training for Tableau administrators. Training includes 30 hours of ha…
4.8 · Rated by learners Certificate of completion
Duration
30 Hours
Mode
Live + Recorded
Level
Beginner → Pro
Language
English / Hindi
AI practice, included with this course
Rehearse the interview and test yourself before the real thing.
Available in your student dashboard as soon as you enrol —
no extra charge, nothing to install.
Course overview
About the Data Visualization Including Machine Learning Concepts using Tableau program.
BISP is now offering an in-depth understanding of Data Visualization Including Machine Learning concepts using Tableau for Tableau developers and complete Tableau Server training for Tableau administrators. Training includes 30 hours of hands-on exposure to ensure that you are left will a feeling of being an expert at the Tableau tool usage. We have considered the industry requirement & devised the course to ensure that you have the practical exposure required to swim through the interviews with ease. The case studies explained towards the end will only reinforce the practice learning to make you complete to face the real world projects & problems which are solved using Tableau. The datasets chosen ensures that you learn every option completely. With a lot of industry connects you get to know the job opportunities which none would otherwise. This course will help you unlock new career opportunities and gain an edge over other analysts. Our course will help you understand architecture,
Why learn with BISP
Trusted by professionals across 30+ countries.
Industry trainers
Certified consultants with 12+ years of real project experience.
Hands-on practice
Real-time scenarios & live project modules, not just slides.
Placement support
Resume building, mock interviews & job referrals.
Certification
BISP certificate + full guidance for official exams.
Course curriculum
Designed by real-time industry professionals around current job roles.
Tableau is one of the most widely used data visualization, reporting, and business intelligence tools in the world and has regularly been ranked as a leader in the Gartner Magic Quadrant. Tableau is simple to use and has extensive visualization capabilities that make it the reporting tool of choice for enterprises around the world.
The Tableau training including machine learning concepts organized by BISP help on acquiring important skills you can use on the job such as using statistical tools and analytics, creating reports and dashboards, and mastering the many aspects of data visualization and it helps in clearing Tableau Desktop 10 Certification.
02Introduction to Data Visualization with Tableau2 topics
What is Data Visualization?
Identify the prerequisites, goal, objectives, methodology, and Goal.
03Architecture of Tableau4 topics
What is Tableau?
Features of Tableau.
Installation of Tableau Desktop.
The interface of Tableau(Layout/Toolbars/Data Pane/Analytics Pane etc).
04Managing Data Sources3 topics
Connection to various data sources
Mysql Database connectivity and tables
ODBC and other sources connectivity
05Introduction to Visual Analytics with Tableau.4 topics
Introduction to various charts
Bar Charts, Line Graphs, Pie Charts
Maps, Scatter Plots, Gantt Charts, Bubble Charts
Treemaps and Box-and-Whisker Plots
06Deep dive into Visualization5 topics
Highlighting Tables, Heat Maps.
Circle Plots
Side By Sidebar charts, Dual Axis Charts, Area Charts.
Waterfall Charts, Bump Chart, Word Cloud Chart, Pareto Charts.
Multiple fields: continuous and discrete visualization
07Data Organization and Scripting7 topics
Calculated Metrics, Apply Sorting on Dimension and Measures.
Calculating Total and Subtotals.
Various Aggregated measures, Percentages.
Data Spotlighting, Summary Card, Date and Time Functions.
Logical Functions.
Hierarchies, Groups, and Bins.
Prediction with extrapolation
08Working with Time Dimension5 topics
Quick Table Calculations.
Custom Table Calculations,
YTD, Parallel Period, Moving Averages.
Running totals, Window Averages,
Trend Lines and Predictive Models
09Data Incremental Loading and Data Blending2 topics
Data Blending from multiple source systems Creating Incremental Loads
Creating File Extractions, Parameters
10Python: Environment Setup and Essentials12 topics
Python Environment Installation and Configuration.
Jupyter Notebook Installation
Jupyter Notebook Introduction
Variable Assignment
Basic Data Types: Integer, Float, String, None, and Boolean; Typecasting
Creating, accessing, and slicing tuples
Creating, accessing, and slicing lists
Creating, viewing, accessing, and modifying dicts
Creating and using operations on sets
Basic Operators: 'in', '+', '*'
Functions
Control Flow
11Data Manipulation with Python (Pandas)9 topics
Introduction to Pandas
Data Structures
Series
DataFrame
Missing Values
Data Operations
Data Standardization
Pandas File Read and Write Support
SQL Operation
12Machine Learning with Python (ScikitLearn)9 topics
Introduction to Machine Learning
Machine Learning Approach
How Supervised and Unsupervised Learning Models Work
13Apply Machine learning concepts in Tableau5 topics
Linear Regression.
Clustering (K -Means)
Data Forecasting
Pearson correlation coefficient
Integrate Tableau with Python using Tabby server.
14Tableau Server Comprehensive12 topics
Single Installer
Worker Installer
Authentication
Processes
Data Server
Create the First Admin User
Create Projects and Groups
Assign Permissions to Projects
Data Connections
Metadata management
Connecting to data with Data Server
Updating data sources
Course details
Who it is for, what you need, and how it is delivered.
Who should learn Data Visualization Including Machine Learning Concepts using Tableau?
Data Scientists, Business Intelligence Professionals, Testing Professionals Statisticians, Business Analysts, Project Managers Data Visual Analysts Functional Experts Graduates and Professionals looking to move to analytics domain
Prerequisites
Basic programing knowledge
Knowledge of database basics
Delivery methodology
We are using an experiential delivering methodology that blends theoretical concepts with hands-on practical learning to ensure a holistic understanding of the subject or course.
Class delivery
Live Interactive classes with expert
Certificate of completion
Earn an industry-recognised BISP Trainings certificate when you finish the course.
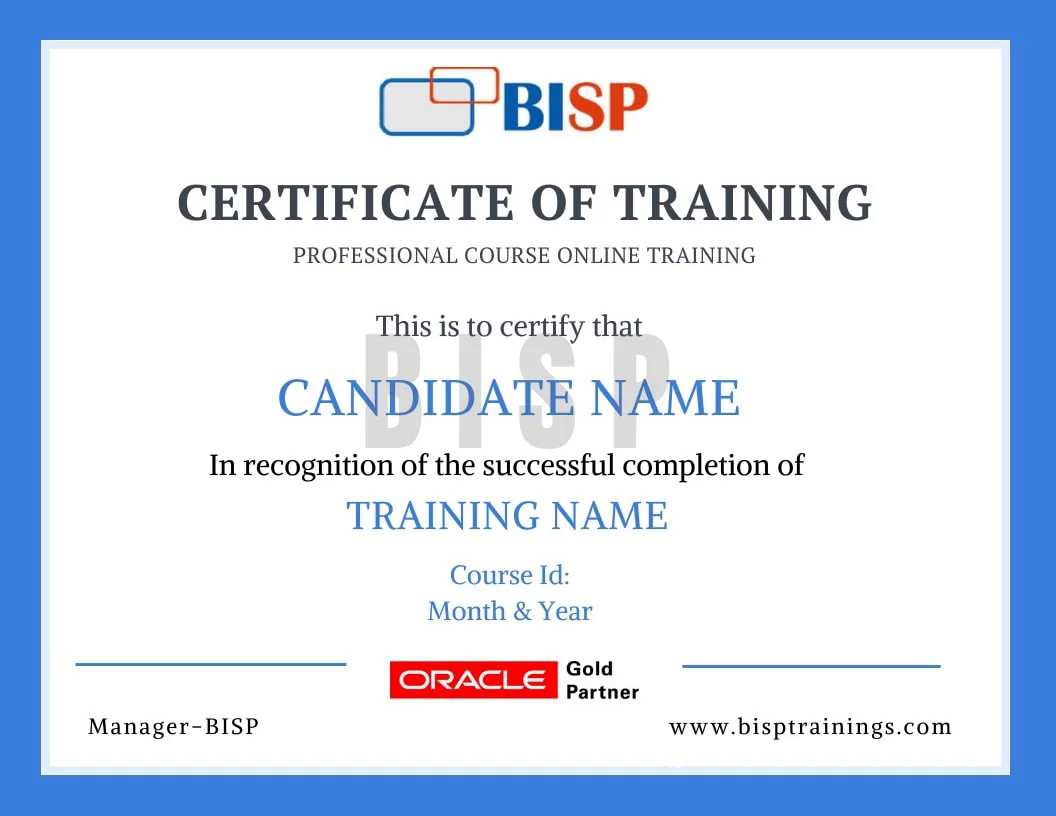
Verifiable certificate with a unique ID
Shareable on LinkedIn & your resume
Recognised by our hiring partners
Frequently asked questions
Everything you need before you enroll.
Can I attend a demo session before enrollment?
Yes. You may attend a demo class before enrollment for training quality evaluation, and interact one-to-one with the trainer for any specific requirement.
Can you schedule training as per my availability?
Yes. We discuss it with the trainer and schedule the training at a convenient time for you.
What if I miss a class?
You get the recorded session. You may also retake the whole training multiple times within a 6-month period with the same trainer.
Is there live project training?
Yes. The curriculum includes real-time scenarios and live project modules, with the trainer explaining every topic end-to-end.
How can I pay for the course?
Enroll securely via the payment gateway on this page using card, UPI or net-banking. EMI options are available.
More queries?
Call us at +91 769-409-5404 & +1 678-701-4914, or write to support@bisptrainings.com.
Case studies & learning PDFs
Free BI and Data Visualization resources to explore.