Live online batches across IST, EST & GST — learners in 189+ countries
Home Courses BI and Data Visualization Tableau Data Discovery
BI and Data Visualization

Tableau Data Discovery

Tableau certification master program will let you gain proficiency in Tableau desktop and server. You will on work on real world projects in Tableau desktop, server tools, dashboard, web interface, R connectivity, publishing, data aggregat…

4.8  ·  Rated by learners Certificate of completion
Duration
25 Hours
Mode
Live + Recorded
Level
Beginner → Pro
Language
English / Hindi

Course overview

About the Tableau Data Discovery program.

Tableau certification master program will let you gain proficiency in Tableau desktop and server. You will on work on real world projects in Tableau desktop, server tools, dashboard, web interface, R connectivity, publishing, data aggregation and blending.

Why learn with BISP

Trusted by professionals across 30+ countries.

Industry trainers

Certified consultants with 12+ years of real project experience.

Hands-on practice

Real-time scenarios & live project modules, not just slides.

Placement support

Resume building, mock interviews & job referrals.

Certification

BISP certificate + full guidance for official exams.

Course curriculum

Designed by real-time industry professionals around current job roles.

Download curriculum (PDF)

Topics to be covered

  1. Introduction
  • Why Tableau? Why Visualization?
  • Introduction to different Tableau components.
  • Tableau data processing engine and how it internally works
  • Installing Tableau Desktop


  1. Connecting to Data
  • Creating a Data Connection
  • Understanding Live and Extract connection
  • Dimensions and Measures
  • Using Show Me!
  • Tour of Shelves
  • Building Basic Views
  • Saving a Data Source, Sharing a Data Source on the server.
  • Saving and sharing your work
  • Understanding Changes to Data
  • Other Data Connection Options in Tableau. 


  1. Working with Single Data Sources
  • Desktop Data Architecture
  • Using Data Extracts
  • Custom SQL Data Connection


  1. Using Multiple Data Sources
  • All About Joins
  • Using Data Blending


  1. Organizing your Data
  • Using Groups
  • Creating and Using Hierarchies
  • Creating a Combined Field
  • Using Sets


  1. Using Multiple Measures on the Same Axis
  • Comparing Views with Multiple Measures
  • Using Measure Values and Measure Names
  • Combo Charts
  • Combined or Shared Axis Charts
  • Creating Dual Axis Charts


  1. Using Parameters for Dynamic Values
  • Customizing your Data
  • Calculation Types
  • Creating Calculated Fields
  • Using Logic Statements
  • Type Conversions and Date Calculations
  • Using Quick Table Calculations
  • Calculations and Aggregations


  1. Slicing your Data by Date
  • Working with Dates
  • Using Discrete Date Parts
  • Creating Date Filters
  • Defining a Fiscal Year
  • Creating Custom Dates


  1. Data Sources, Extracts, Schedules, and Subscriptions
  • Creating, Publishing, and Connecting to a Data Source
  • Data Engine and File Store
  • Creating and Publishing Extracts
  • Backgrounder
  • Schedules
  • Subscriptions


  1. Data Security
  • Controlling What Users Can See 
  • User Filters


  1. Viewing Distributions
  • Bins and Histograms
  1. Using Calculations in Tableau
  • Creating and Editing Calculated Fields
  • Calculations Performed on the Database
  • Calculations and Aggregations
  • Aggregating Dimensions in Calculations
  • Record Level Calculations for Date Conversion


  1. Advanced Table Calculations
  • Table Calculation Scope and Direction
  • Null Values in Table Calculations
  • Table Calculations for Statistical Analysis


  1. Creating and Using Parameters
  • Using Parameters and Reference Lines
  • Using Parameters with Filters


  1. Comparing Measures Against a Goal
  • Showing Total Progress Toward a Goal (Bar in Bar Graph)
  • Showing Staged Progress Toward a Goal (Bullet Graph)
  • Showing the Biggest and the Smallest Values


  1. Tableau Geocoding
  • How Tableau Performs Automatic Geocoding of Data
  • Modifying Geocode Locations within Tableau
  • Custom Geocoding


  1. Advanced Mapping
  • Dual Axis Maps
  • Mapping Paths
  • Using Background Images for Spatial Analysis


  1. Showing Distributions of Data
  • Creating a Pareto Chart
  • Box and Whisker Plots
  • Reference Distributions


  1. Statistics and Forecasting
  • Trend Lines
  • Forecasting


  1. Dashboards: Quick Filters, Actions, and Parameters
  • Comparing Quick Filters, Actions, and Parameters
  • Highlight Actions
  • Filter Actions
  • URL Actions


  1. Dashboard Best Practices
  • Sizing
  • Using Instructions
  • Dashboard Formatting


  1. Overview of Additional Visualizations
  • Gantt Bar Chart
  • Sparkline
  • Waterfall Charts
  • Pie Charts and Parts of the Whole
  • Creating Tree Map


Course details

Who it is for, what you need, and how it is delivered.

Who should learn Tableau Data Discovery?

Data Scientists, Business Intelligence Professionals, Testing Professionals Statisticians, Business Analysts, Project Managers Data Visual Analysts Functional Experts Graduates and Professionals looking to move to analytics domain

Prerequisites

Tableau really has no prerequisites in a general sense. As a Business Intelligence tool, Tableau focuses on building data visualizations

Delivery methodology

We are using an experiential delivering methodology that blends theoretical concepts with hands-on practical learning to ensure a holistic understanding of the subject or course.

Class delivery

Live Interactive classes with expert

Certificate of completion

Earn an industry-recognised BISP Trainings certificate when you finish the course.
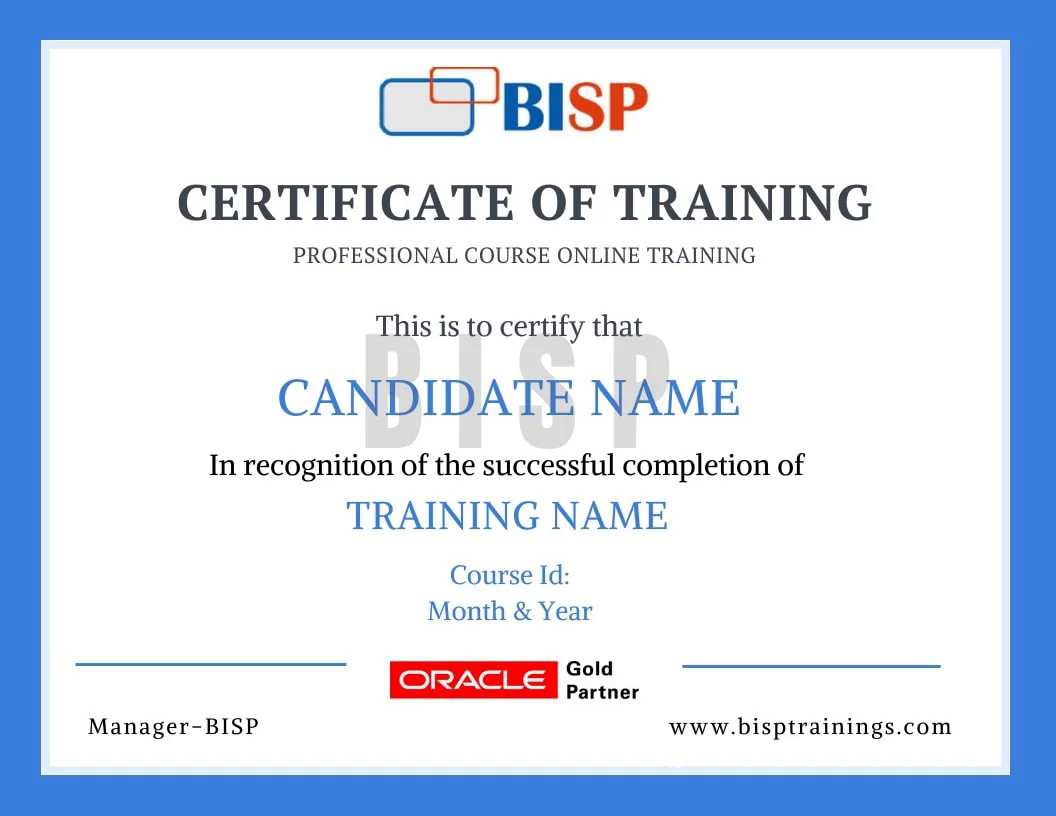
BISP Trainings Certificate of Completion
  • Verifiable certificate with a unique ID
  • Shareable on LinkedIn & your resume
  • Recognised by our hiring partners

Frequently asked questions

Everything you need before you enroll.

Can I attend a demo session before enrollment?

Yes. You may attend a demo class before enrollment for training quality evaluation, and interact one-to-one with the trainer for any specific requirement.

Can you schedule training as per my availability?

Yes. We discuss it with the trainer and schedule the training at a convenient time for you.

What if I miss a class?

You get the recorded session. You may also retake the whole training multiple times within a 6-month period with the same trainer.

Is there live project training?

Yes. The curriculum includes real-time scenarios and live project modules, with the trainer explaining every topic end-to-end.

How can I pay for the course?

Enroll securely via the payment gateway on this page using card, UPI or net-banking. EMI options are available.

More queries?

Call us at +91 769-409-5404 & +1 678-701-4914, or write to support@bisptrainings.com.

Case studies & learning PDFs

Free BI and Data Visualization resources to explore.

Relevant courses

Learners who took this also explored these.

Not sure if this course is right for you?

Book a free 1-on-1 counselling call and get a personalised learning roadmap.

Book free trial →