Live online batches across IST, EST & GST — learners in 189+ countries
Live online batches across IST, EST & GST — learners in 189+ countries
In this course you will be going to work on real world project, learn about data discovery, self-service analytics, interactive dashboard, data visualization, Qlik Sense Reports. Qlik Sense is one of the fastest growing Business Intelligen…
Rehearse the interview and test yourself before the real thing.
Answer role-based questions out loud, then read the report on how you did. Five attempts come with the course.
Unlocked on enrolFree5 AI mock interviewsEach one scored, with a written report you can actually act on.Included in the course feeA fresh 40-question assessment is written each time you start — 200 questions across the module, with the reasoning behind every answer.
Unlocked on enrolFree5 practice assessments40 questions each, 200 across the module — every answer explained.Included in the course feeEvery attempt is kept in your dashboard, so you can see which topics improved and which still need work.
Unlocked on enrolFreeYour progress, trackedEvery attempt kept, so you can see exactly what improved.Yours from day oneAbout the Qlik Sense program.
Trusted by professionals across 30+ countries.
Certified consultants with 12+ years of real project experience.
Real-time scenarios & live project modules, not just slides.
Resume building, mock interviews & job referrals.
BISP certificate + full guidance for official exams.
Designed by real-time industry professionals around current job roles.
Download curriculum (PDF)What is Data Visualization?
Data visualization is the presentation of data in a pictorial or graphical format. With the help of data, you can visualize easily and extract valuable information for business stakeholders. From Interactive visualization, you can take the concept a step further by using technology.
Why data visualization is important for Businesses?
As human brain processes with information, we can use charts or graphs to visualize large amounts of complex data. It is easier to process and identify information, also we can do forecast based on the prior data information and poring over spreadsheets or reports. Patterns, trends, and correlations that might go undetected in text-based data can be exposed and recognized easier with a data visualization tool. Qlik sense Data visualization tool plays an important role in big data and advanced analytics projects and Businesses.
Why Data Visualization by Qlik Sense?
Qlik sense is also one of the best data visualization tools. Data Analyst like Qlik Sense because of Drag and drop feature. Qlik sense has been designed for a user at any level can use with ease i.e. Manager, Analyst, Developer & end user. You can use Qlik Sense for visualization of data or you may call with the help of data you can visualize easily and extract valuable information for business stakeholders.
Why learn Qlik Sense?
Learning is a necessary skill; you can advance yourself with our structured curriculum. We have three modules for Qlik sense learning – Core, Effective, and Continuous Learning. Learn advanced scripting capabilities and big data solution with Qlik Sense. Communicate and collaborate with instructors in a virtual training environment. Expert teaches about different data architectures and how to manage them also provide guidance for the certification. The candidate will learn Data and BI visualization, hands-on experience over applications, security and access features, Qlik Sense data modeling, visualization, reporting, Chart-level, and script-level Qlik functions.
The candidate will be able to accelerate their career with a developer certification program with us. We have world-class experienced Trainers and faculty. Encourage yourself to become master in trending data visualization skills. Our course had been designed by industry professionals specific to your organization’s need. Training module includes data analytics, data literacy skills create Visualizations, data discovery, how to design effective visualizations & storytelling. After completion of training the candidate has expertise over concepts, Qlik Sense architecture, create data models. Confidently use data load editor, data manager, maintaining data connections, resolve data structure issues, script errors, data transformation, deploying single and multi-node configurations, token configuration, data and system security, data analysis using smart search, designing and developing Qlik Sense apps, on-demand app generation. Efficiently create reports such as PowerPoint reports, Word reports, Excel reports, Pixel, Perfect reports, HTML reports, filters.
Delivery Methodology
We are using an experiential delievering methodology that blends theoretical concepts with hands-on practical learning to ensure a holistic understanding of the subject or course
Who it is for, what you need, and how it is delivered.
This is a perfect course for those who wanted to enter in the field of visualization
This certification training course does not presume or require any prior knowledge or prerequisites. However, basic knowledge of DWH and visualization concepts be an added advantageous.
We are recommending that students should have following:
We are using an experiential delivering methodology that blends theoretical concepts with hands-on practical learning to ensure a holistic understanding of the subject or course.
Live Interactive classes with expert
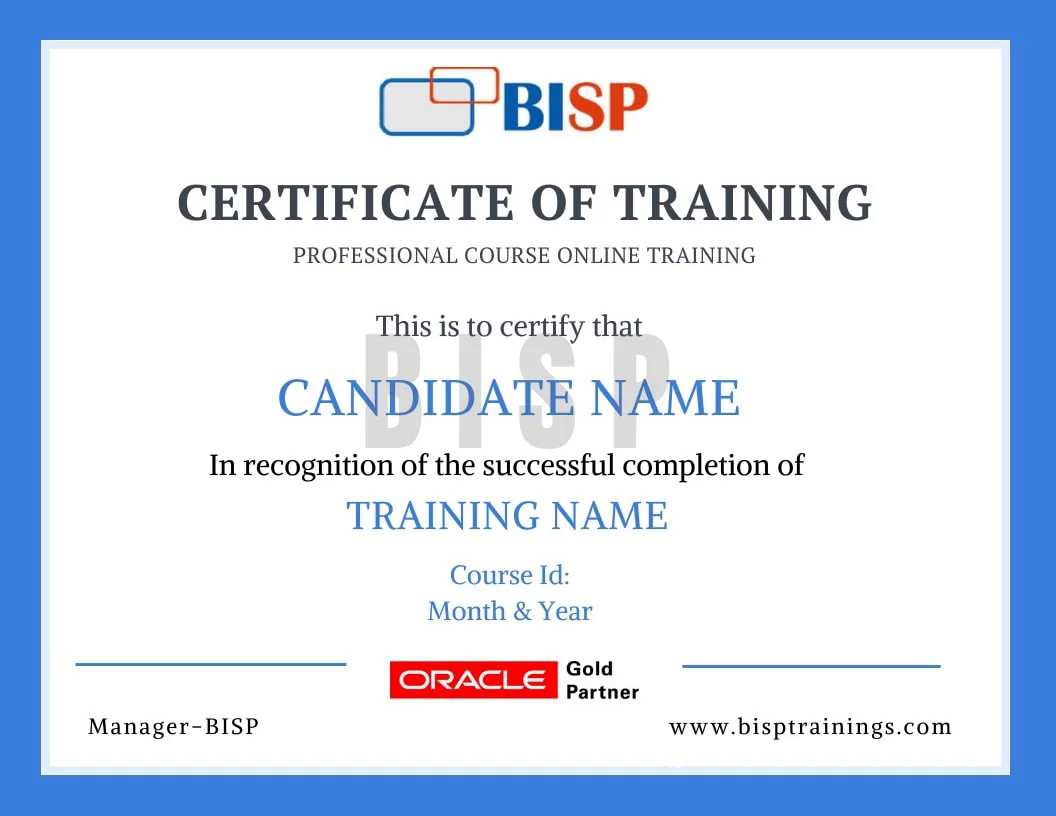
Earn an industry-recognised BISP Trainings certificate when you finish the course.
Reserve your seat for the next live session.
| Session | Date | Time | Reserve |
|---|---|---|---|
| D | 24 Oct 2026 (Sat) | 08:00 | Reserve seat → |
| R | 27 Oct 2026 (Tue) | 08:00 | Reserve seat → |
Everything you need before you enroll.
Yes. You may attend a demo class before enrollment for training quality evaluation, and interact one-to-one with the trainer for any specific requirement.
Yes. We discuss it with the trainer and schedule the training at a convenient time for you.
You get the recorded session. You may also retake the whole training multiple times within a 6-month period with the same trainer.
Yes. The curriculum includes real-time scenarios and live project modules, with the trainer explaining every topic end-to-end.
Enroll securely via the payment gateway on this page using card, UPI or net-banking. EMI options are available.
Call us at +91 769-409-5404, or write to support@bisptrainings.com.
Free BI and Data Visualization resources to explore.
Learners who took this also explored these.
Book a free 1-on-1 counselling call and get a personalised learning roadmap.
 +91 769-409-5404




.png)