Home›Courses›IBM›Cognos Build Data Marts Reports and Dashboards
IBM
Upskill with BISP
Powered By AI
Cognos Build Data Marts Reports and Dashboards
This course is designed to prepare professional real world cognos reports. Teaches participants how to move, merge, consolidate, and transform data from a range of data sources to buildand maintain subject-area data marts. In the process,…
4.8 · Rated by learners Certificate of completion
Duration
25 Hours
Mode
Live + Recorded
Level
Beginner → Pro
Language
English / Hindi
AI practice, included with this course
Rehearse the interview and test yourself before the real thing.
Available in your student dashboard as soon as you enrol —
no extra charge, nothing to install.
Course overview
About the Cognos Build Data Marts Reports and Dashboards program.
This course is designed to prepare professional real world cognos reports. Teaches participants how to move, merge, consolidate, and transform data from a range of data sources to buildand maintain subject-area data marts. In the process, students will create a catalog and add connections to data sources and targets. They will also deliver fact and dimension data to a data mart through the use of builds and the dimensional framework. In addition, students will learn how to automate common functionality and handle complex data issues, such as unbalanced hierarchical structures. It is designed for professional report authors to learn fundamental and advanced report building techniques using relational data models, and methods of enhancing, customizing, and managing professional reports. Attendees will participate in hands-on demos and workshops that illustrate key concepts while learning how to use the product.
Why learn with BISP
Trusted by professionals across 30+ countries.
Industry trainers
Certified consultants with 12+ years of real project experience.
Hands-on practice
Real-time scenarios & live project modules, not just slides.
Placement support
Resume building, mock interviews & job referrals.
Certification
BISP certificate + full guidance for official exams.
Course curriculum
Designed by real-time industry professionals around current job roles.
Define data warehousing and its key underlying concepts
Identify how Data Manager creates data warehouses
Examine the Data Manager architecture and user interface
02Create Derivations4 topics
Examine derivations
Apply operators and functions to derivations
Examine the derivation timing model
Add derivations to a fact build
03Process Dimensional History and Late Arriving Facts6 topics
Examine slowly changing dimensions (SCDs)
Use surrogate keys in SCDs
Manage type 1 and type 2 changes to dimensional data
Load historical data for a dimension
Examine late arriving facts
Process late arriving facts in a fact build
04Customize Fact Data Processing4 topics
Filter fact data
Merge duplicate fact data
Examine fact data integrity checking
Reject fact data
05Automate Functionality Using Commands4 topics
Differentiate between the Command Line Interface (CLI) and Data Manager Designer
Identify common commands
Use commands in a batch file
Examine variables
06Pivot Fact Data3 topics
Examine pivoting
Use the single pivot technique
Use the advanced pivot technique
07Create List Reports4 topics
Format, group, and sort list reports
Describe options for aggregating data
Create a multi-fact query
Create a report with repeated data
08Present Data Graphically3 topics
Create charts containing peer and nested items
Add context to charts
Present key data in a single dashboard report
09Present Data Using Maps2 topics
Present data using map reports
Navigate to another level within a map
10Create Query Reports Based on Relationships3 topics
Create reports by merging query results
Create reports by joining queries
Combine data containers based on relationships from different queries
11Enhance UserInteraction with HTML2 topics
Create tooltips that clarify report data
Send emails using links in a report
12Create a Catalog5 topics
Examine the purpose and contents of Data Manager catalogs
Create a catalog
Define connections to source and target data
Access data using SQLTerm
Configure flat data source files using SQLTXT
13Create Conformed Dimensions4 topics
Examine conformed dimensions and their advantages
Design conformed dimensions
Create conformed dimensions
Create data integrity lookups that use conformed dimensions
14Transform Data Using Lookups and Derived Dimensions5 topics
Identify when to use lookups
Identify the requirements for a lookup
Create a translation lookup
Create an optional lookup
Add derived dimensions to fact builds
15Aggregate, Filter, and Partition Fact Data5 topics
Aggregate fact data
Examine aggregate rules
Vertically restrict fact data
Horizontally restrict fact data
Partition fact data
16Customize Functionality with User-Defined Functions and Variables3 topics
Examine user defined functions (UDFs)
Create an internal UDF
Create a user-defined variable
17Resolve Data Quality Issues4 topics
Identify data quality and cleansing issues
Handle fostered and unmatched members
Perform debugging using SQLTerm and functions
Assess the quality of output data
18Focus Reports Using Filters3 topics
Create filters to narrow the focus of reports
Examine detail and summary filters
Determine when to apply filters on aggregate data
19Focus Reports Using Prompts4 topics
Identify various prompt types
Use parameters and prompts to focus data
Customize prompts to facilitate users' choices
Display users' prompt selections in the report
20Customize Reports with Conditional Formatting3 topics
Create multi-lingual reports
Highlight exceptional data
Conditionally render objects in reports
21Design Effective Prompts4 topics
Control report displays using prompts
Specify conditional formatting values using prompts
Specify conditional rendering of objects based on prompt selection
Create sorted and filtered reports based on prompt selection
22Create Hierarchies6 topics
Examine the role of the dimensional framework in Data Manager
Examine hierarchies and their data sources
Identify how to create hierarchies from the columns of one table, the rows of one table, and from multiple tables
Test and view hierarchies
Create a hierarchy of static date values
Handle weeks in a date hierarchy
23Customize Reference Structures6 topics
Create hierarchies manually using different approaches
Examine the features of a hierarchy
Examine literals
Set data access for hierarchy levels
Examine static and dynamic members
Examine fostering
24Customize Data Delivery3 topics
Configure fact and dimension delivery modules
Create indexes on fact and dimension tables
Update fact data using keys
25Implement Job Control4 topics
Examine where job control fits into the data warehouse lifecycle
Create a JobStream
Add, link, and reposition nodes
Execute a JobStream and view the results
26Process Unbalanced Hierarchical Data4 topics
Examine balanced, unbalanced, and ragged hierarchies
Add a recursive level to a hierarchy
Identify ways to balance a hierarchy and delivered flattened data
Examine circular references
27Organize and Package Data Manager Components2 topics
Export and import components using packages
Search for components in a catalog using Navigator
28Create Crosstab Reports4 topics
Format and sort crosstab reports
Convert a list to a crosstab
Create crosstabs using unrelated data items
Create complex crosstabs using drag and drop functionality
29Extend Reports Using Calculations3 topics
Create calculations based on data in the data source
Add run-time information to the reports
Create expressions using functions
30Drill-through Definitions4 topics
Enable users to navigate to related data in IBM Cognos BI
Parameter-driven drill through vs. dynamic drill through
Steps to enable drill-through access for a package
Limit the items that users can drill through from (set scope)
31Create Additional Advanced Reports4 topics
Create a report that displays summarized data before detailed data
Highlight alternate rows in a list report
Create a report using an external data file
Use single data items to summarize report information
Course details
Who it is for, what you need, and how it is delivered.
Who should learn Cognos Build Data Marts Reports and Dashboards?
Business Intelligence, Analytics and Reporting Professionals
IT Developers, Testers, Project Managers, Data Scientists, and Statisticians
Prerequisites
Anybody can take up this training regardless of their skills. However, having a basic knowledge of SQL is beneficial.
Delivery methodology
We are using an experiential delivering methodology that blends theoretical concepts with hands-on practical learning to ensure a holistic understanding of the subject or course.
Class delivery
Live Interactive classes with expert
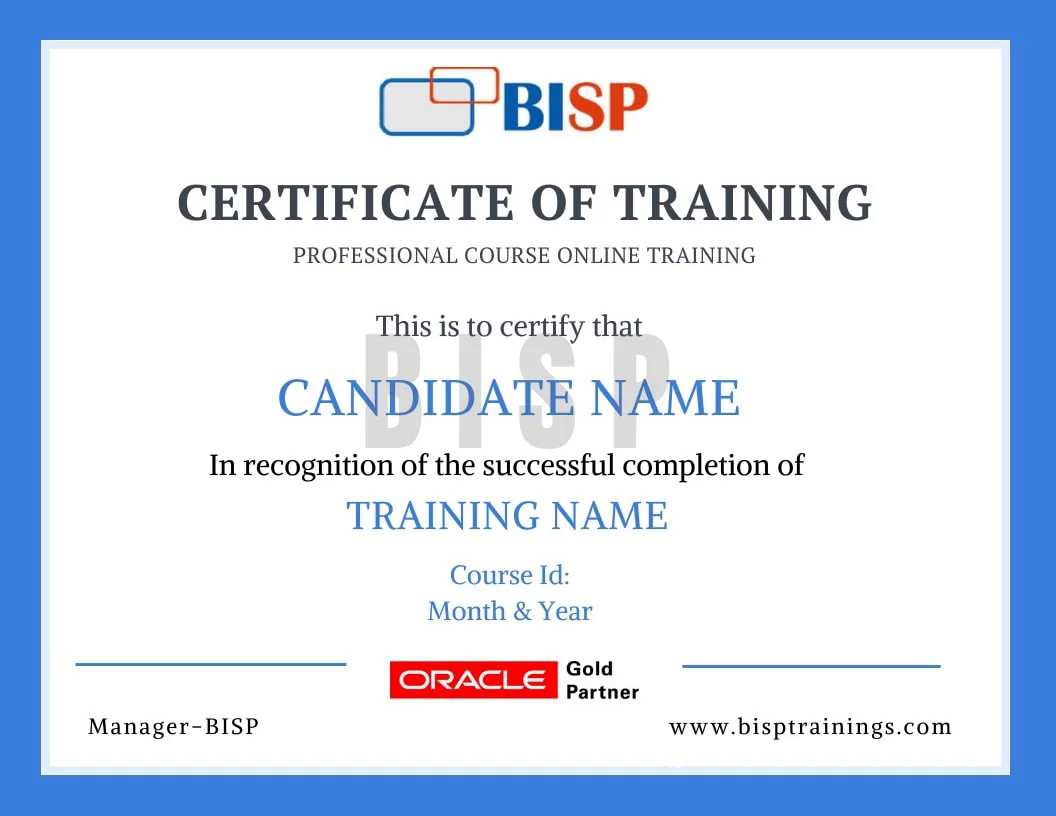
Certificate of completion
Earn an industry-recognised BISP Trainings certificate when you finish the course.
Verifiable certificate with a unique ID
Shareable on LinkedIn & your resume
Recognised by our hiring partners
Frequently asked questions
Everything you need before you enroll.
Can I attend a demo session before enrollment?
Yes. You may attend a demo class before enrollment for training quality evaluation, and interact one-to-one with the trainer for any specific requirement.
Can you schedule training as per my availability?
Yes. We discuss it with the trainer and schedule the training at a convenient time for you.
What if I miss a class?
You get the recorded session. You may also retake the whole training multiple times within a 6-month period with the same trainer.
Is there live project training?
Yes. The curriculum includes real-time scenarios and live project modules, with the trainer explaining every topic end-to-end.
How can I pay for the course?
Enroll securely via the payment gateway on this page using card, UPI or net-banking. EMI options are available.
More queries?
Call us at +91 769-409-5404 & +1 678-701-4914, or write to support@bisptrainings.com.


 Call Us: +91 769-409-5404