Benefits of Spotfire:
Spotfire helps to identify the area in which there needs to be an improvement. Let us take a scenario, your analyst in your organization and you find there is an economic crisis and the shares that you bought are falling, so you analyze the data from previous years and find the shares that will boom in the upcoming days and ask your organization to invest in those shares. Spotfire helps to find the facts that ruin customer and organization relationships. Spotfire helps to analyze the fall and rise of a product in the market through graphical representation of the sales and reviews of the product data It predicts sales volumes. Through Spotfire future can be predicted by analyzing the past and current data by using statistical techniques. TIBCO Spotfire significantly reduces the cost of ownership by enabling users to handle hundreds of users over the Internet using just one database.
TIBCO SPOTFIRE:-
Session#1 :
o Introduction to TIBCO Spotfire
Session#2:
o Spotfire Architecture in Detail
Session#3:
o Analytics, BI with Spotfire
Session#4:
o Learn about Information Links, Default Visualization & Spotfire Library
Session#5:
o Use/Import Data from various Files, Excel. Use of Underlying Data Tables
Session#6:
o Using an Interactive Analysis Environment
Session#7:
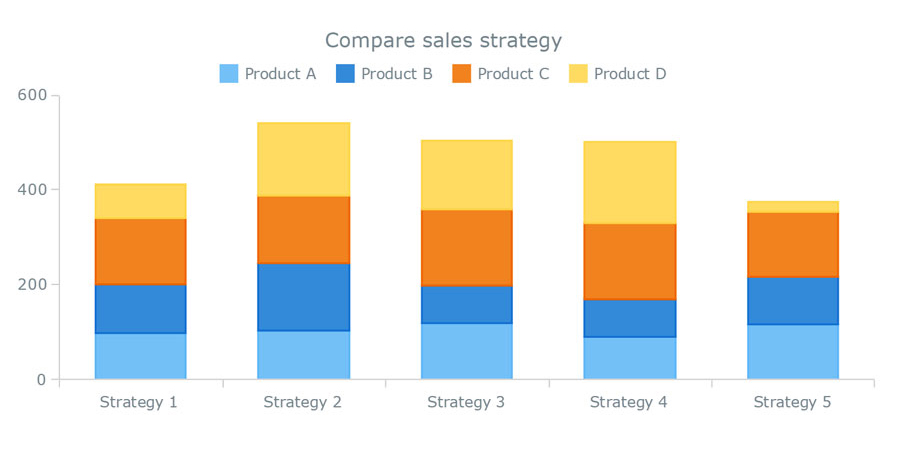
o VISUALIZATIONS Demo: Configure and Interpret Bar Charts,
Aggregations,Selectors, Multiple Scales, Visualization properties etc.
Session#8:
o VISUALIZATIONS Demo: Trellis Visualizations to Subdivide Data,
Create Continuous Data Groupings through Auto-Binning
Session#9:
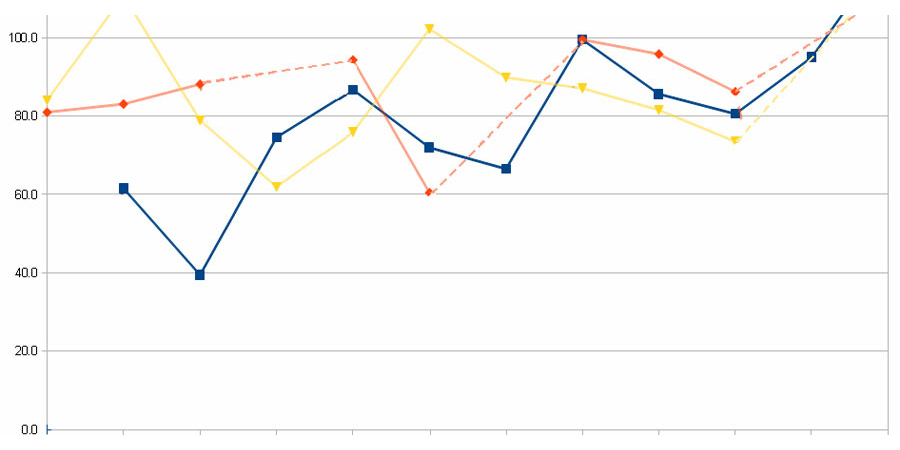
o Configure and Interpret Line Charts, Configure and Interpret
Graphical Tables
Session#10:
o Configure and Interpret Scatter Plots, Understand Color Options
and Configure Color Schemes
Session#11:
o Configure and Interpret Tables and the Details-on-Demand Panel,
Create hyperlinks to URLs within Tables
Session#12:
o Configure and Interpret Summary Tables and Cross Tables, Include
Images on Visualizations
Session#13:
o CONFIGURE INTERACTIVITY: Drill-Down More About Data of Interest,
Configure the Content of Tooltip Information Boxes
Session#14:
o Learn How to Mark Data and What Marking Can Accomplish & Configure
Multiple Markings for Different Visualizations
Session#15:
o Create Details Visualizations, Configure Details Visualizations
for Serial Drill-Down
Session#16:
o Configure Visualizations to be Limited by Multiple Markings
Session#17:
o Create and Apply Different Filtering Schemes, Change Filter Types
and Organize Filters.
Session#18:
o Save & Export: Value of Saving Data Linked to the Source, Data
Setting to Embed Data, Reload Data or Replace the Data Table, Export
Data to the Library, Images to PDF or Edit Images in PowerPoint etc.
Session#19:
o Data Transformation (Insert Column, Pivot, Unpivot, Insert Rows)
Session#20:
o "Information Designer"(Data Source, Columns, Filters, Procedures, Joins)
Session#21:
o Introduction to Python in Spotfire with a couple of examples.
Session#22:
o Licenses,& Library Administration
"No Resources for this Course"

.png)


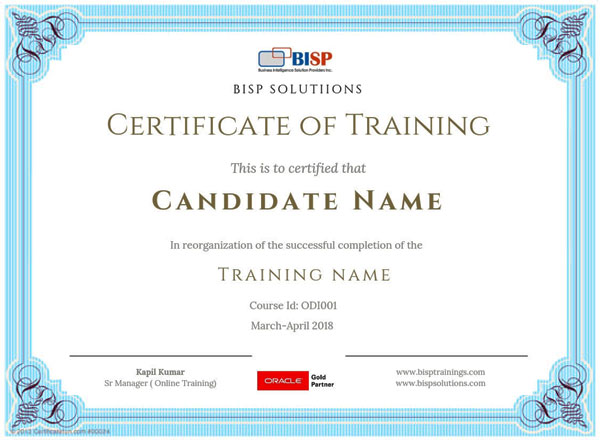
Certification demonstrates your dedication, motivation and technical knowledge on a specific platform. Having a certification shows that you not only possess comprehensive knowledge of that technology but you also care enough about your own career to spend the time and money to get the certification.
We are welcoming our Students or professionals to participate in our professional online courses. We are offering great variety of online training programs and professional courses that you can always find as desired. After the completion of training program they will receive a certificate from BISP. As a Certified professional you can apply that knowledge in your future profession and enjoy with better salaries & career prospects.